2025年1月12日星期日

Happy New Year!! First entry in 2025!


1. Possible Head and Shoulder Top.

2. Profit target >200 points is huge range and may not be possible to meet.

3. There is a nearest downside resistance around 5800 which is extended from the double dips at the starts of 3rd Oct & 4th Nov.

4. The breakout bar with higher volume than the usual.


2024年12月22日星期日

Find a better entry price!

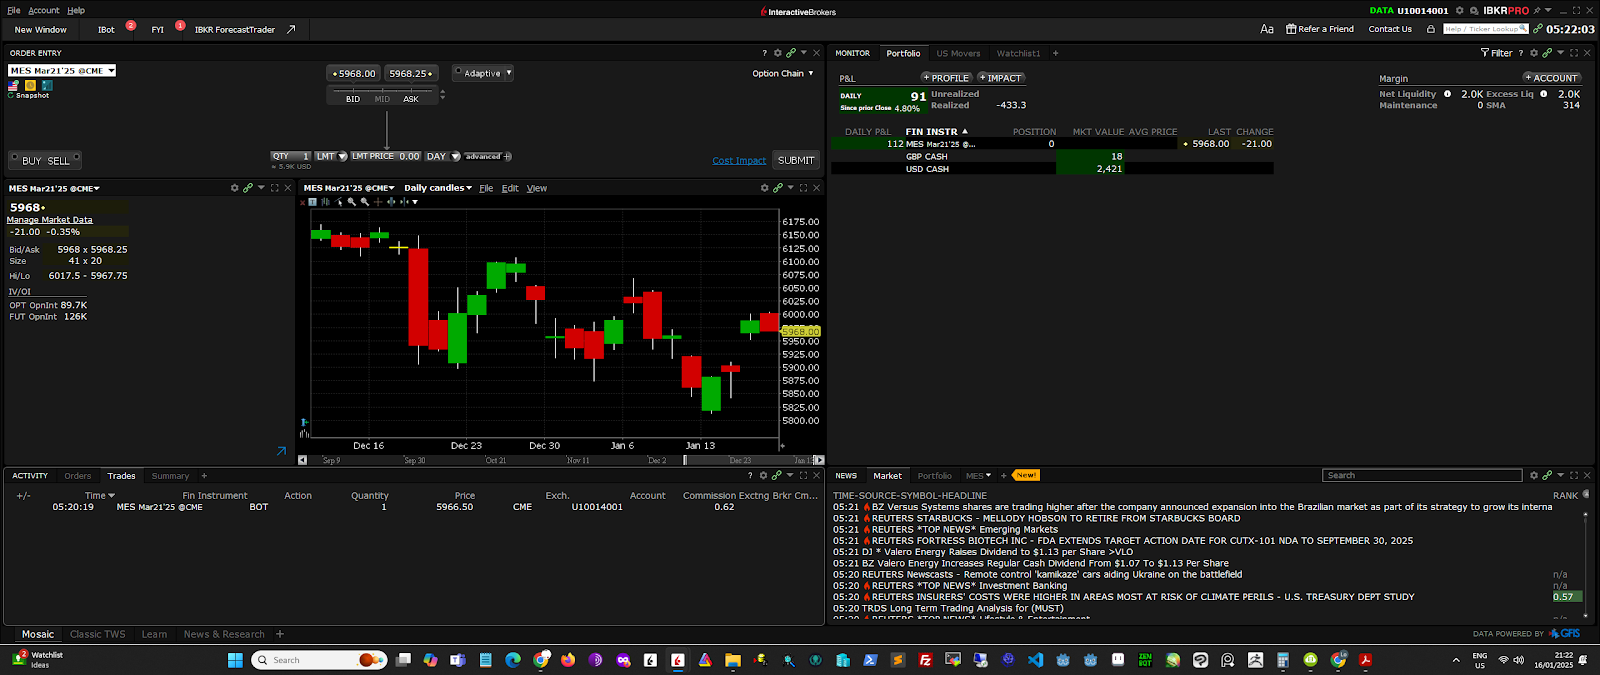
 One thing, too late to enter the trade, the entry target is 6127.25, but it slips to 6118.75 as entry price after next opening session at the same day @ 1100 pm. While EZ pulls back over 6148 next day, so that means a better entry price existed in the next day everytime after trade entrys. The executed target price hurts the profit at the end.


2024年10月31日星期四

It's a ridiculously huge MISTAKE!!!! (Overlapping trades)

 After a small loss and small profit, I faced a new chance for a downside trade. It worked into my favour and went quite well with my theory, but I've made a big mistake!!! I put in the SAME profit taking price as my buy-in market price!! This is absolutely unforgiving and what a casual mistake!!! Damn it!

Fig. 1: same prices of profit taking and current market price.

Another thing which is worth noting for this downside trade that the triggering point to open the trade is before the closing position of last trade. That means the current trade is overlapping with the previous trade. I was still hesitating for opening the current trade. But after I thought thoroughly, every trade is likely and contains certain likelihood to be profitable according to my thesis, I still insisted to open this trade. Finally, the outcome is good.
Fig. 2: overlapping trades.

Fig. 3: Final result.


2024年10月12日星期六

Very good materials about Trading and Risk


Improvement idea

    This time, I opened the trade after the bar confirmed after the market close at 10:00 pm of 20241009, rather than 5 to 10 mins before trade hour close. Literally, I opened the trade after 11:00 pm of 20241009. I chose to open the trade when the daily bar complete entirely on the chart.

    However, I found that it may be better to open the trade until next day trading hour. As the market tends to run into opposite direction to the trade bias. It also provides 10 to 20 points margin to enter the trade. You can see the RED daily bar after the tradable signal bar in the chart below.

Fig 1: Trade open at 20241009.

After the last loser trade, the trend line for triggering new trade becomes an little upwards trend rather than downwards. I tend to trade with flat or little tilted trendline, instead of steep one.

          Fig 2: HA chart shows ligitimate breakout and OHLC depicts a wonderful upwards pattern.