2024年12月22日星期日

Find a better entry price!

 One thing, too late to enter the trade, the entry target is 6127.25, but it slips to 6118.75 as entry price after next opening session at the same day @ 1100 pm. While EZ pulls back over 6148 next day, so that means a better entry price existed in the next day everytime after trade entrys. The executed target price hurts the profit at the end.


2024年10月31日星期四

It's a ridiculously huge MISTAKE!!!! (Overlapping trades)

 After a small loss and small profit, I faced a new chance for a downside trade. It worked into my favour and went quite well with my theory, but I've made a big mistake!!! I put in the SAME profit taking price as my buy-in market price!! This is absolutely unforgiving and what a casual mistake!!! Damn it!

Fig. 1: same prices of profit taking and current market price.

Another thing which is worth noting for this downside trade that the triggering point to open the trade is before the closing position of last trade. That means the current trade is overlapping with the previous trade. I was still hesitating for opening the current trade. But after I thought thoroughly, every trade is likely and contains certain likelihood to be profitable according to my thesis, I still insisted to open this trade. Finally, the outcome is good.
Fig. 2: overlapping trades.

Fig. 3: Final result.


2024年10月12日星期六

Very good materials about Trading and Risk


Improvement idea

    This time, I opened the trade after the bar confirmed after the market close at 10:00 pm of 20241009, rather than 5 to 10 mins before trade hour close. Literally, I opened the trade after 11:00 pm of 20241009. I chose to open the trade when the daily bar complete entirely on the chart.

    However, I found that it may be better to open the trade until next day trading hour. As the market tends to run into opposite direction to the trade bias. It also provides 10 to 20 points margin to enter the trade. You can see the RED daily bar after the tradable signal bar in the chart below.

Fig 1: Trade open at 20241009.

After the last loser trade, the trend line for triggering new trade becomes an little upwards trend rather than downwards. I tend to trade with flat or little tilted trendline, instead of steep one.

          Fig 2: HA chart shows ligitimate breakout and OHLC depicts a wonderful upwards pattern.

Grinding with low volatility! Mental stability is king!

 The emotion up and down is so unbearable. I have to get used to this emotional fluctuation and it's so grinding once the trade is in such low volitility situation before US President election day in the early of November.

Sadly, the trade is a loser but it was just down with several points. That is very acceptable. Unfortunately, this trade have been waited to open since early August. After that time, the volitily still kept high but no trading signal is in place. However, the volitility decreased a lot just the trade open. It's so grinding to hold a trade with up or down within 15-point range per day.

Luckily, market will tell you the direction! You can see losers as a taxation for the coming winners. You are just a strategy manager, remember! See the next trade, the market will reveal the direction itself.

Anyway, the execution of this trade is faultless!

Fig 1. Trade Open at 20240919 at 21:45p.

Fig 2. Trade Close at 20241002 at 21:44p.


Fig 3. Trade Open account status.

Fig 4. Trade Close account status.


2024年8月1日星期四

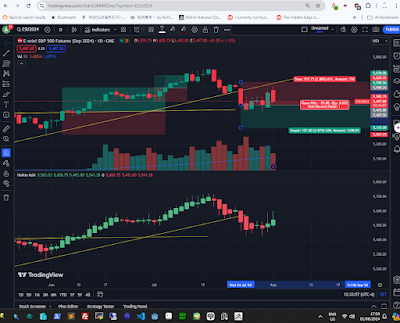
Losing Trade!! But it's exited too early!! Don't quit without signal complete!!!!

 I exited this trade too early without waiting til the daily bar completed!!! Big mistake!!

                                Fig 1. bar @ 2:00 pm, guessing it will be an up flat-bottom bar but....
Fig 2. close up

Fig 3. Around 5:30 pm!!!

This mistake is avoidable and at least we have to wait the real exit signal to proceed. We need to hold back even we feel greedy or fear within the trade.


Fig 4. In

Fig 5. Out
Once the trade ends, it can't re-entrace, need to wait for another signal.
Fig 6. Final outcome after Friday! The price almost reaches the TP target!!! What!?


2024年7月20日星期六

Finally correction appears!

 Let's see how the uptrend slope being penetrated within the coming week!


2024年7月17日星期三

Sub-trade after main trade


After close of the main trade, there is an opportunity for the sub-trade. But this after trade is quite risky, the buildup for the top is not so strong. The bars at the top are not deterministic. Up/down bars or doji appeared around the top.

Obviously, the accumulation phase before the sub-trade can be seen as part of the sub-trade to measure the stop-loss level before the entry.


2024年7月4日星期四

重新出發

 I'm completely starting over with a new swing trade strategy, which makes use of the ES/MES futures of SPY to target RR=1:1 trading opportunities.

This strategy is so simple but the most hardship on executing this strategy nicely should be put on the psychological side. Let's dive into the illustration below.


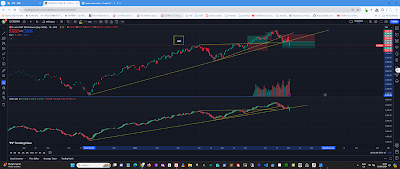
The trade only lasts for 21 trading days. However, 8 days of them are range bounded (i.e. see the red bracket in the HA chart). That means no obvious dominating directions in these 8 days. It's unusual on my backtesting records and this is a psychological torture. If you are not disciplinary enough or faint-hearted, you might be shaken off from the original plan.

Of course, I've increased my frequecy on checking stock chart during this grinding period, I was so nervous obviously! But I still followed to what I've planned and this trade got a extremely good outcome in the end.

One thing should be mentioned is that the future contract should be rolled over manually and adjusted the profit taking and stop loss price on your own as well.

Lastly, any profit should be protected intentioanlly. In this case, I've moved my stop loss from breakeven to the lowest point of 11th June, once it stayed at an attractive profit level since the trade opened.